- Silver extends Friday’s late pullback from its highest level since early February.
- The technical setup support prospects for the emergence of some dip-buying.
- A convincing break below the $22.00 mark would negate the positive outlook.
Silver comes under some selling pressure on the first day of a new week and retreats further from its highest level since February 03, around the mid-$23.00s touched on Friday. The white metal maintains its offered tone through the early European session and is currently flirting with the daily low, around the $23.00 round-figure mark.
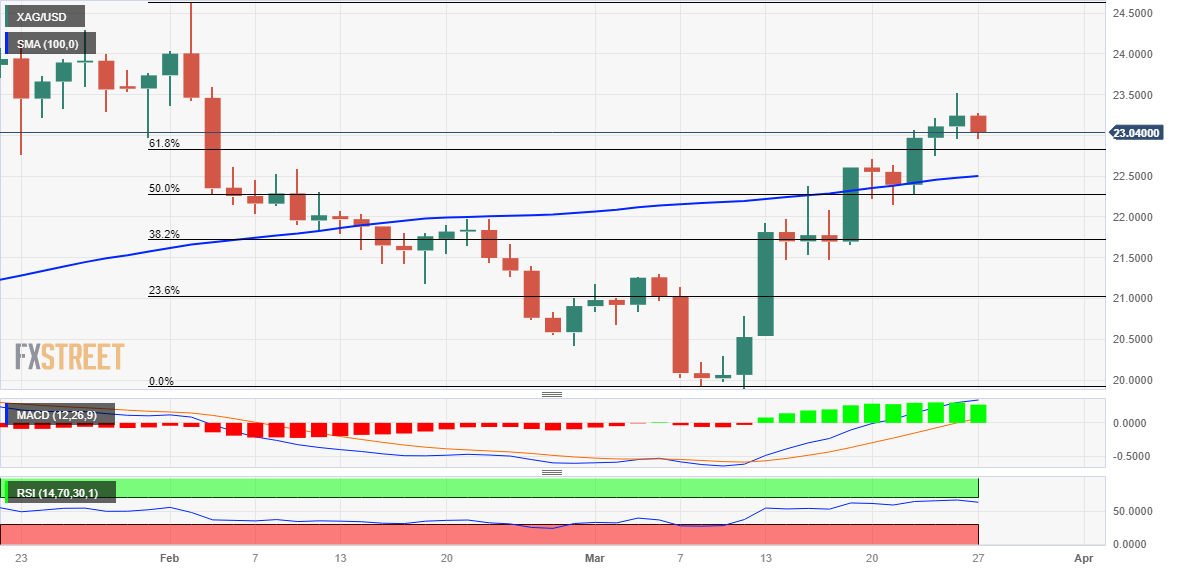
From a technical perspective, last week’s sustained breakthrough and acceptance above the 61.8% Fibonacci retracement level of the recent pullback from a multi-month peak favours bullish traders. Moreover, oscillators on the daily chart are holding comfortably in the positive territory and add credence to the constructive setup. Hence, any subsequent slide is more likely to find decent support near the said resistance breakpoint, around the $22.80 region.
That said, some follow-through selling, leading to a further slide below the $22.50 area, has the potential to drag the XAG/USD towards the 50% Fibo. level, around the $22.20 region. This is followed by the $22.00 round figure, which if broken decisively will expose the 38.2% Fibo. level support near the $21.75-$21.70 zone. Failure to defend the said support levels will negate the positive outlook and shift the near-term bias in favour of bearish traders.
On the flip side, the daily swing high, around the $23.25 area, now seems to act as an immediate hurdle ahead of the mid-$23.00s, or the multi-week top set on Friday. A sustained move beyond should pave the way for additional gains and allow the XAG/USD to aim to reclaim the $24.00 round figure. The momentum could get extended towards testing the multi-month peak, around the $24.65 region touched in February, en route to the $25.00 psychological mark.
Silver daily chart

Key levels to watch
XAG/USD
| OVERVIEW | |
|---|---|
| Today last price | 23.05 |
| Today Daily Change | -0.19 |
| Today Daily Change % | -0.82 |
| Today daily open | 23.24 |
| TRENDS | |
|---|---|
| Daily SMA20 | 21.51 |
| Daily SMA50 | 22.24 |
| Daily SMA100 | 22.48 |
| Daily SMA200 | 20.98 |
| LEVELS | |
|---|---|
| Previous Daily High | 23.52 |
| Previous Daily Low | 22.97 |
| Previous Weekly High | 23.52 |
| Previous Weekly Low | 22.16 |
| Previous Monthly High | 24.64 |
| Previous Monthly Low | 20.42 |
| Daily Fibonacci 38.2% | 23.31 |
| Daily Fibonacci 61.8% | 23.18 |
| Daily Pivot Point S1 | 22.97 |
| Daily Pivot Point S2 | 22.69 |
| Daily Pivot Point S3 | 22.41 |
| Daily Pivot Point R1 | 23.52 |
| Daily Pivot Point R2 | 23.8 |
| Daily Pivot Point R3 | 24.08 |


